

Navicat BI is a tool that helps you organize and transform your data into meaningful information through reporting. This is achieved via interactive dashboards that summarize the insights gained, along with workspaces that may be easily shared with colleagues and business leaders to make informed decisions on both operational (day-to-day) and strategic (long-term) matters. Today's blog will walk you through the process of creating a workspace and data source Navicat BI. Next week's post will cover how to design an interactive chart and present it within a dashboard.
The Chart at a Glance
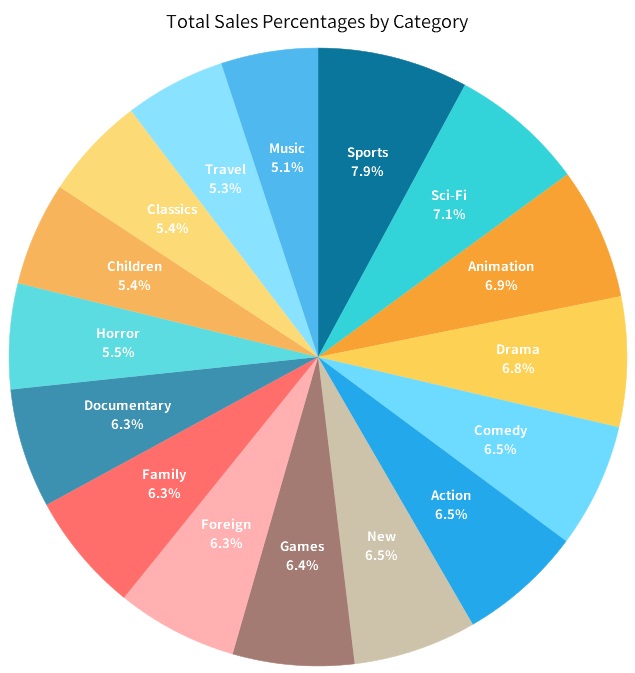
The chart that we will be building will summarize how much was spent on each movie category of the free PostgreSQL "dvdrental" sample database. The data will be presented as a pie chart where each piece will represent a category. Here's a sneak peek at what the chart will look like:
Creating the Workspace
Navicat BI is available as a stand-alone product and is also integrated into Navicat Premium and Enterprise Editions. For the purposes of this tutorial, we'll be working in Navicat Premium 17.
The first step is to create a new workspace. To do that:
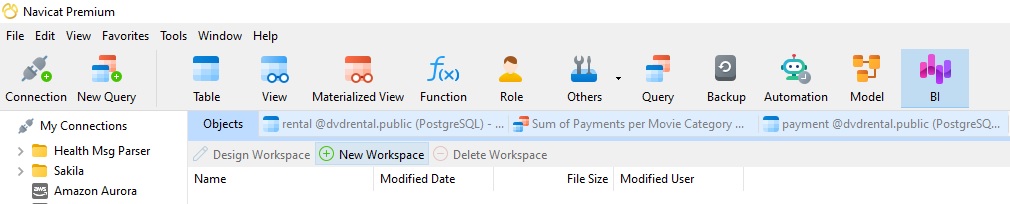
- Locate and click the BI button in the main Button Bar at the top of the main Navicat window.
- Click the New Workspace button:
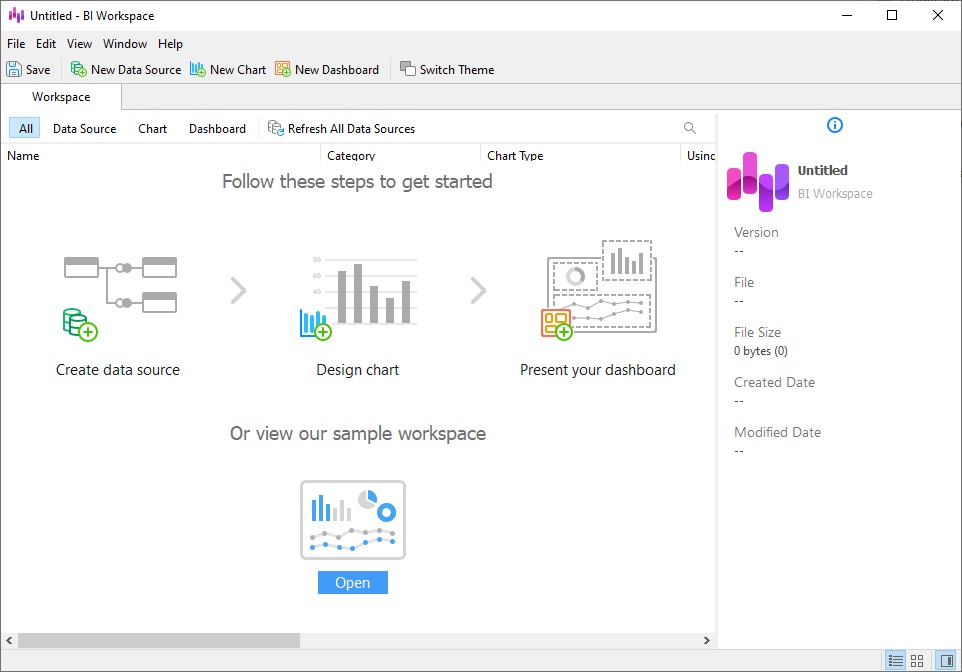
That will launch the BI feature:
Creating the Data Source
The BI feature lets you specify and integrate data from a variety of data sources, including databases (or any ODBC data source), external files such as Excel, Access, CSV, and even data stored on your computer, network, or a URL.
The new workspace clearly shows the steps to create a data visualization:
- Create data source
- Design chart
- Present your dashboard
Since I already have the dvdrental database in Navicat, I'll build the query there and then import it into the BI workspace.
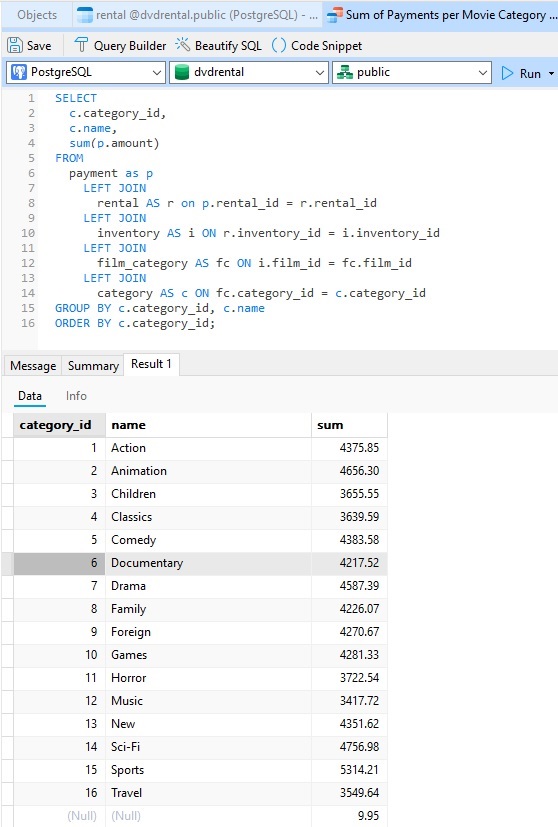
Here is the full SQL statement. It includes an aggregation on the amount column of the payment table that sums its values for each category:
SELECT
  c.category_id,
  c.name,
  sum(p.amount)
FROM
  payment as p
    LEFT JOIN
      rental AS r on p.rental_id = r.rental_id
    LEFT JOIN
      inventory AS i ON r.inventory_id = i.inventory_id
    LEFT JOIN
      film_category AS fc ON i.film_id = fc.film_id
    LEFT JOIN
      category AS c ON fc.category_id = c.category_id
GROUP BY c.category_id, c.name
ORDER BY c.category_id;
Here is the above query in the Navicat Query Editor, along with the results. Note that the query was saved with the name "Sum of Payments per Movie Category". We'll need to recall the name later in order to import the query:
Now we'll create the data source in BI workspace:
- Click the New Data Source button at the top of the BI workspace window.
- Name the data source "Dvdrental" and select PostgreSQL for the Database connection:
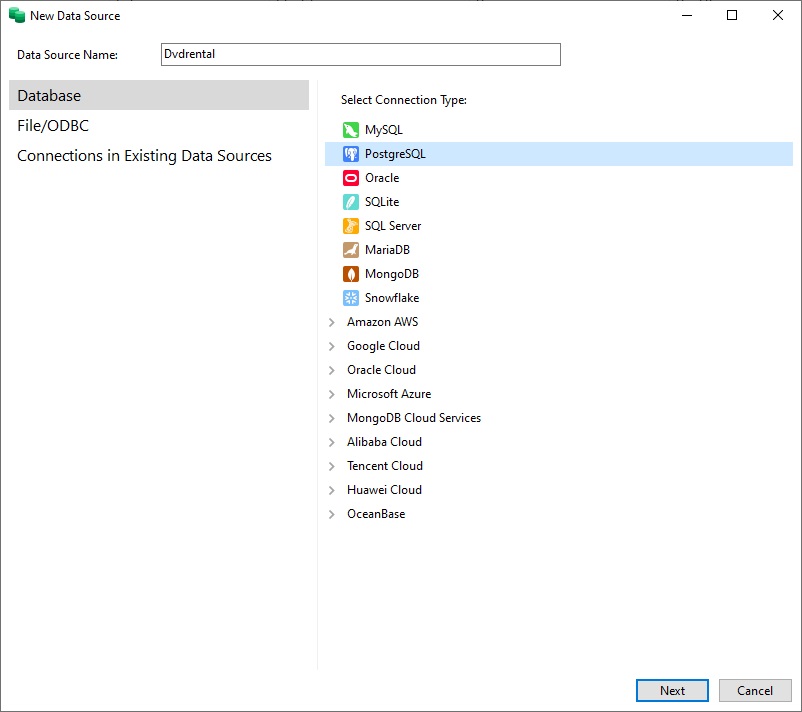
- Click Next to continue.
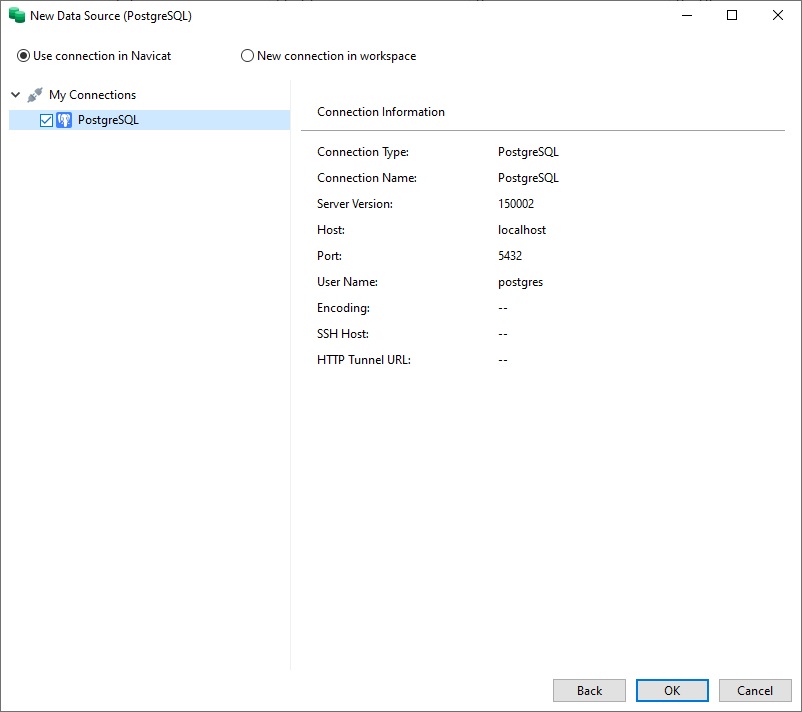
- Select the PostgreSQL connection that contains the dvdrental database (I only have the one) and click OK to create the data source:
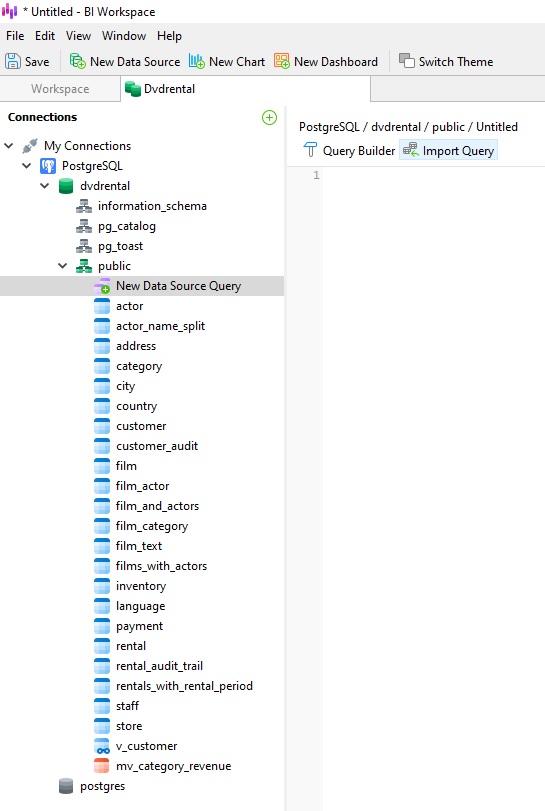
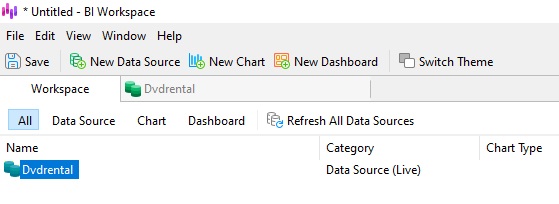
We can now see the PostgreSQL connection in the Connections pane. If we expand it to see the dvdrental database, we can see the New Data Source Query item above the tables. Clicking it will open a new query editor. We could write the query there, but since we already did, we can click the Import Query button instead:
That will launch the Import Query dialog, where we can select the query that we built earlier:
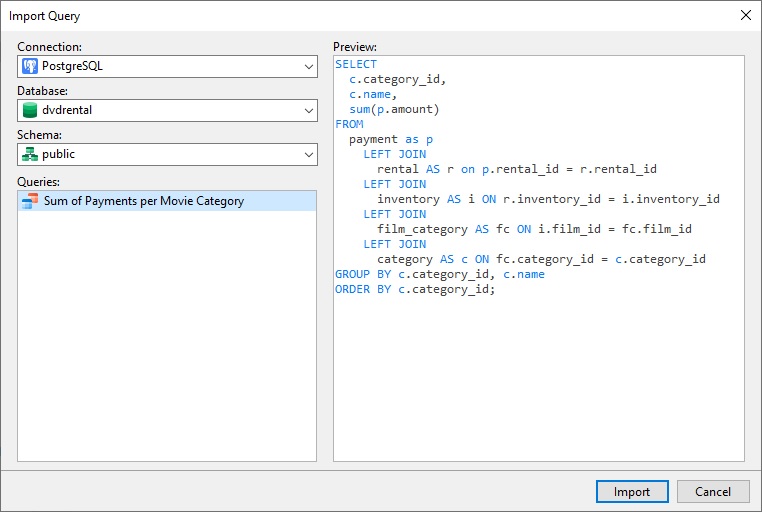
Click the Import button to add it to our workspace.
Going Forward
With the data source in place, we're ready to design the chart. We'll do that in next week's blog. In the meantime, feel free to familiarize yourself with Navicat BI's many chart types, which include Bar Charts, Line/Area Charts, Bar/line Charts, Pie charts, Heatmap/Treemap, Pivot Table, Waterfall Chart, Scatter Chart, Value, Control, KPI/Gauge, and more!
You can download Navicat BI for a 14-day fully functional FREE trial. It's available for Windows, macOS, and Linux operating systems.


