Data Synchronization
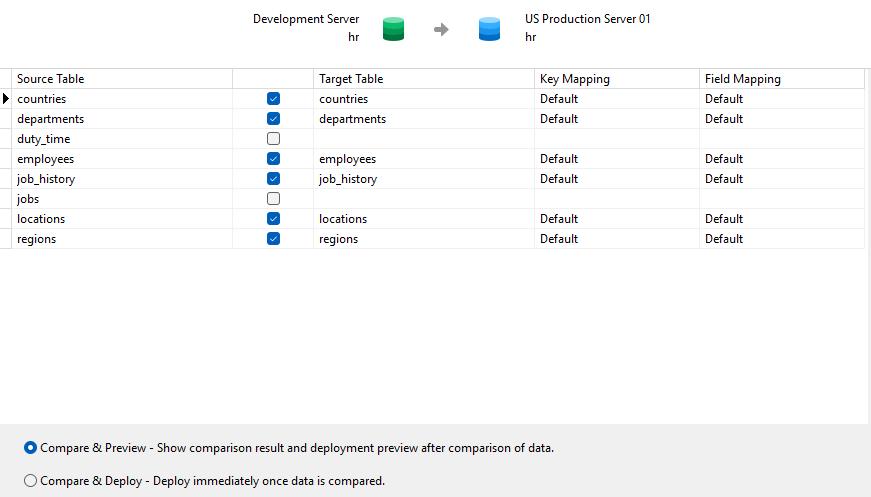
You are now able to choose not to preview the results and deploy directly. Navicat now offers two buttons:
- Compare & Preview: preview the comparison results.
- Compare & Deploy: skip the preview and deploy immediately.

Charts
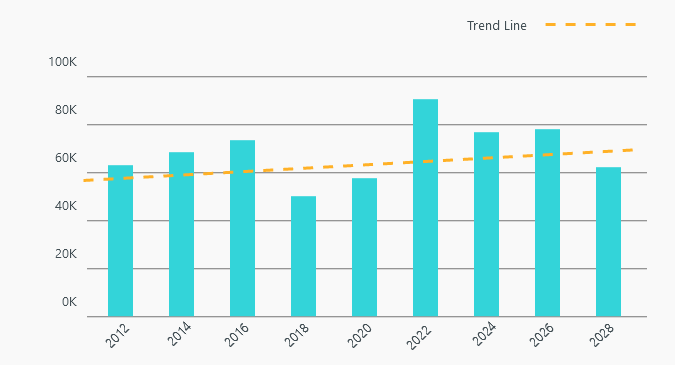
Trend Line supported
Starting with Navicat 16.1, trend line can be added in Vertical/Horizontal Bar Chart, Line Chart, Area Chart, Bar and Line Chart, and Scatter Chart. To make your chart even more understandable and easily interpreted, you can change the default appearance of a trendline. For this, just simply click on Trend Line tab in Properties pane.

Data Viewer
Better view for your data
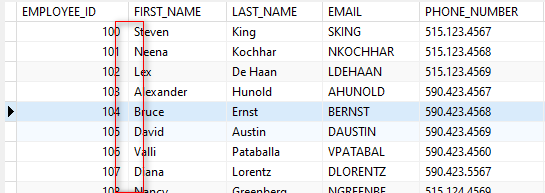
We think you will particularly appreciate the improvement for highlighting the selected row and active cell. You can now easier to see your current place in Grid View.

We’ve improved the data alignment in Grid View. Previously, this made it difficult to view data between number column and text column, but now Navicat handles this situation well.

General
Connection tree
- Pressing Ctrl+F in connection tree will now open the Search box in tree. It activated another Search box before.
- Adding shortcut in submenu to have quick access to create a new connection profile.

Part of knowing your business is tracking sales metrics such as units sold and identifying your best customers. To that end, you'll probably want to begin with fetching data about customers who've made the most purchases throughout the month, quarter, year, or other time period. This data will allow you to analyze their buying patterns and identify trends. This blog will present a few sample queries to do that by combining the mighty Count() function with the GROUP BY and HAVING clauses.
- 2024 (1)
- 2023 (1)
- 2022 (1)
- 2021 (1)
- 2020 (1)
- 2019 (1)
- 2018 (1)
- 2017 (1)


